Role
Junior Product Designer (in collaboration with a senior designer)
Tools
Figma, Miro, pen & paper.
Timeline
3 months (2024).
Project Overview
This feature helps YouTube creators to optimize their existing YouTube shorts for better engagement and views.
Contribution
User flows. 1st and 2nd drafts and part of the UI. Web app screens. Light mode screens.
0.71%
Purchases Rate Increase
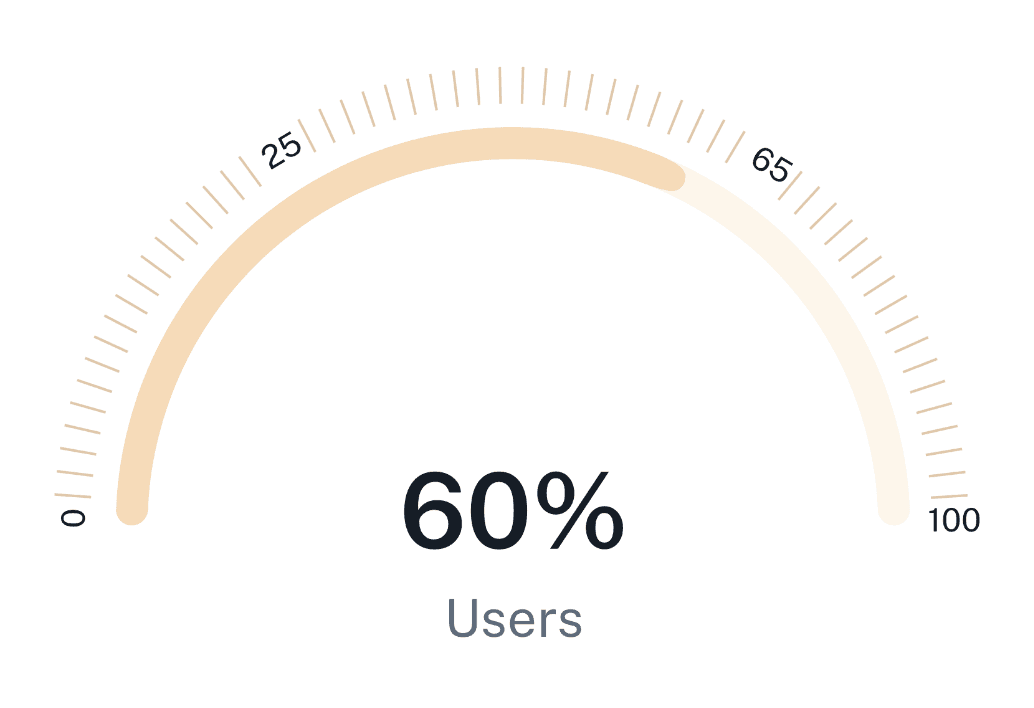
2.3%
User Retention Increase
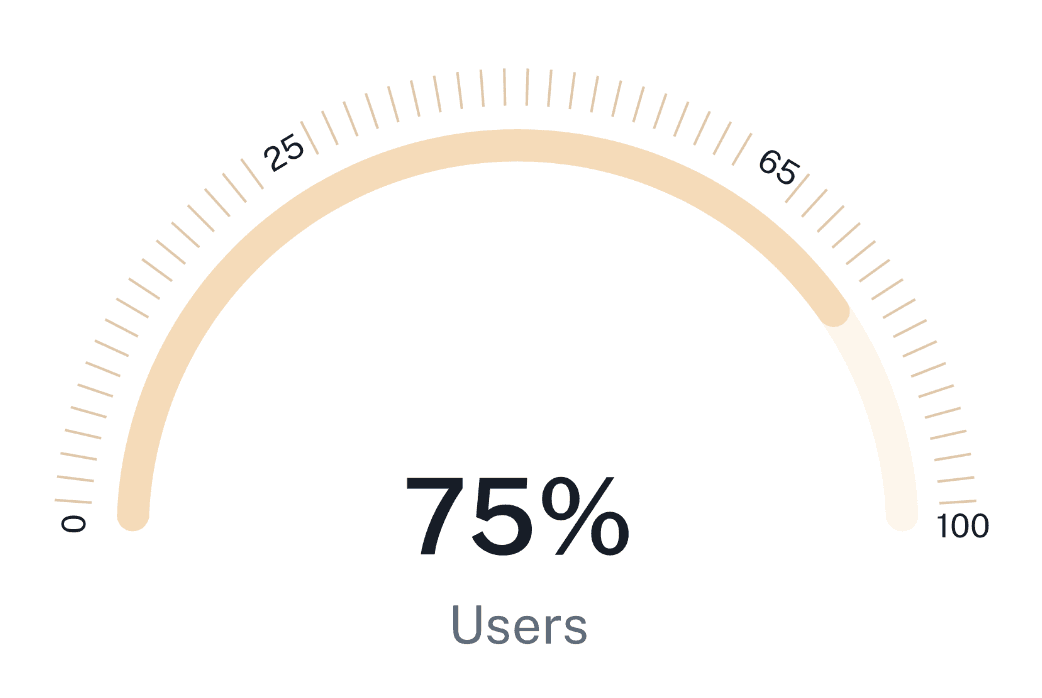
75k
shorts opened daily on optimization
Problem Context
YouTube creators want to find a way to optimize their existing YouTube shorts videos for better views and engagement, but don’t know where to start.
Solution
Optimize feature can solve this problem by offering:
Scores on titles and contents. Each score section will also show a helpful breakdown of how the score was calculated, providing users with valuable feedback on what is working well and where there may be room for improvement.
Suggested titles and tags. Users can use, tweak, or regenerate suggested titles and tags for better search performance and reach a wider audience.
Metrics
Tasks’ completion rate. Retention rate. Conversion rate. NPS.
User Research
We interviewed 15 users to understand 3 key questions:
How do you currently decide on titles and tags for your YT shorts?
What kind of support or tool would help you optimize your YT shorts?
What would make optimization advice feel personalized to your channel?
Mentioned that they are looking for a more personalized guidance on how they can make better quality videos.
Mentioned that they want a step-by-step with overall scores and suggested improvements.
Mentioned that they use AI/SEO tools such as ChatGPT and TubeBuddy to help with titles and tags.
User Journey Map
Based on the product requirements and the competitive analysis, I created wireframes and some explorations for the key features:
User Flow & Wireframes
Flow 1: as a content creator, I want improve my content to get more views.
Flow 2: as a content creator, I want add more popular tags to my shorts to reach a wilder audience.
Flow 3: as a content creator, I want know if my title and content are good enough and how to further improve them.
After analyzing different user flows, I created the flow chart for the feature. Below are some sections of the app flow and wireframes.
Final Design - Feature List
Refined feature set based on user needs and design iterations
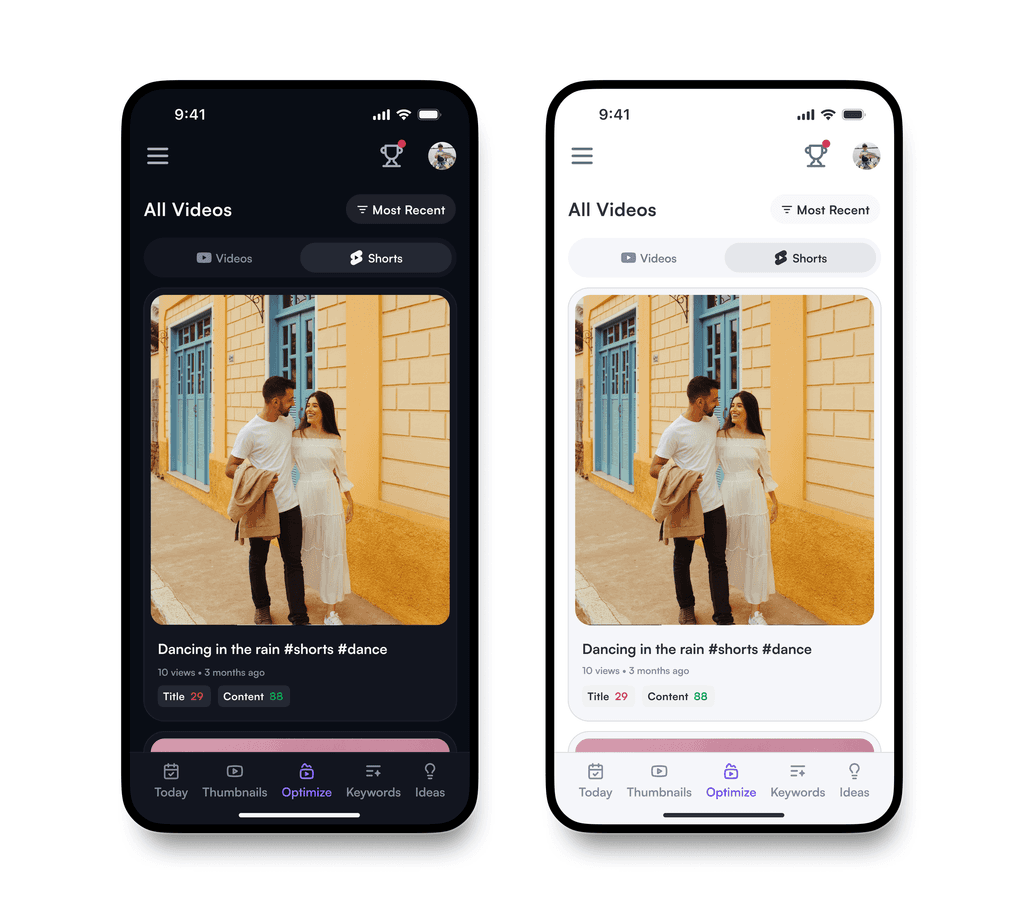
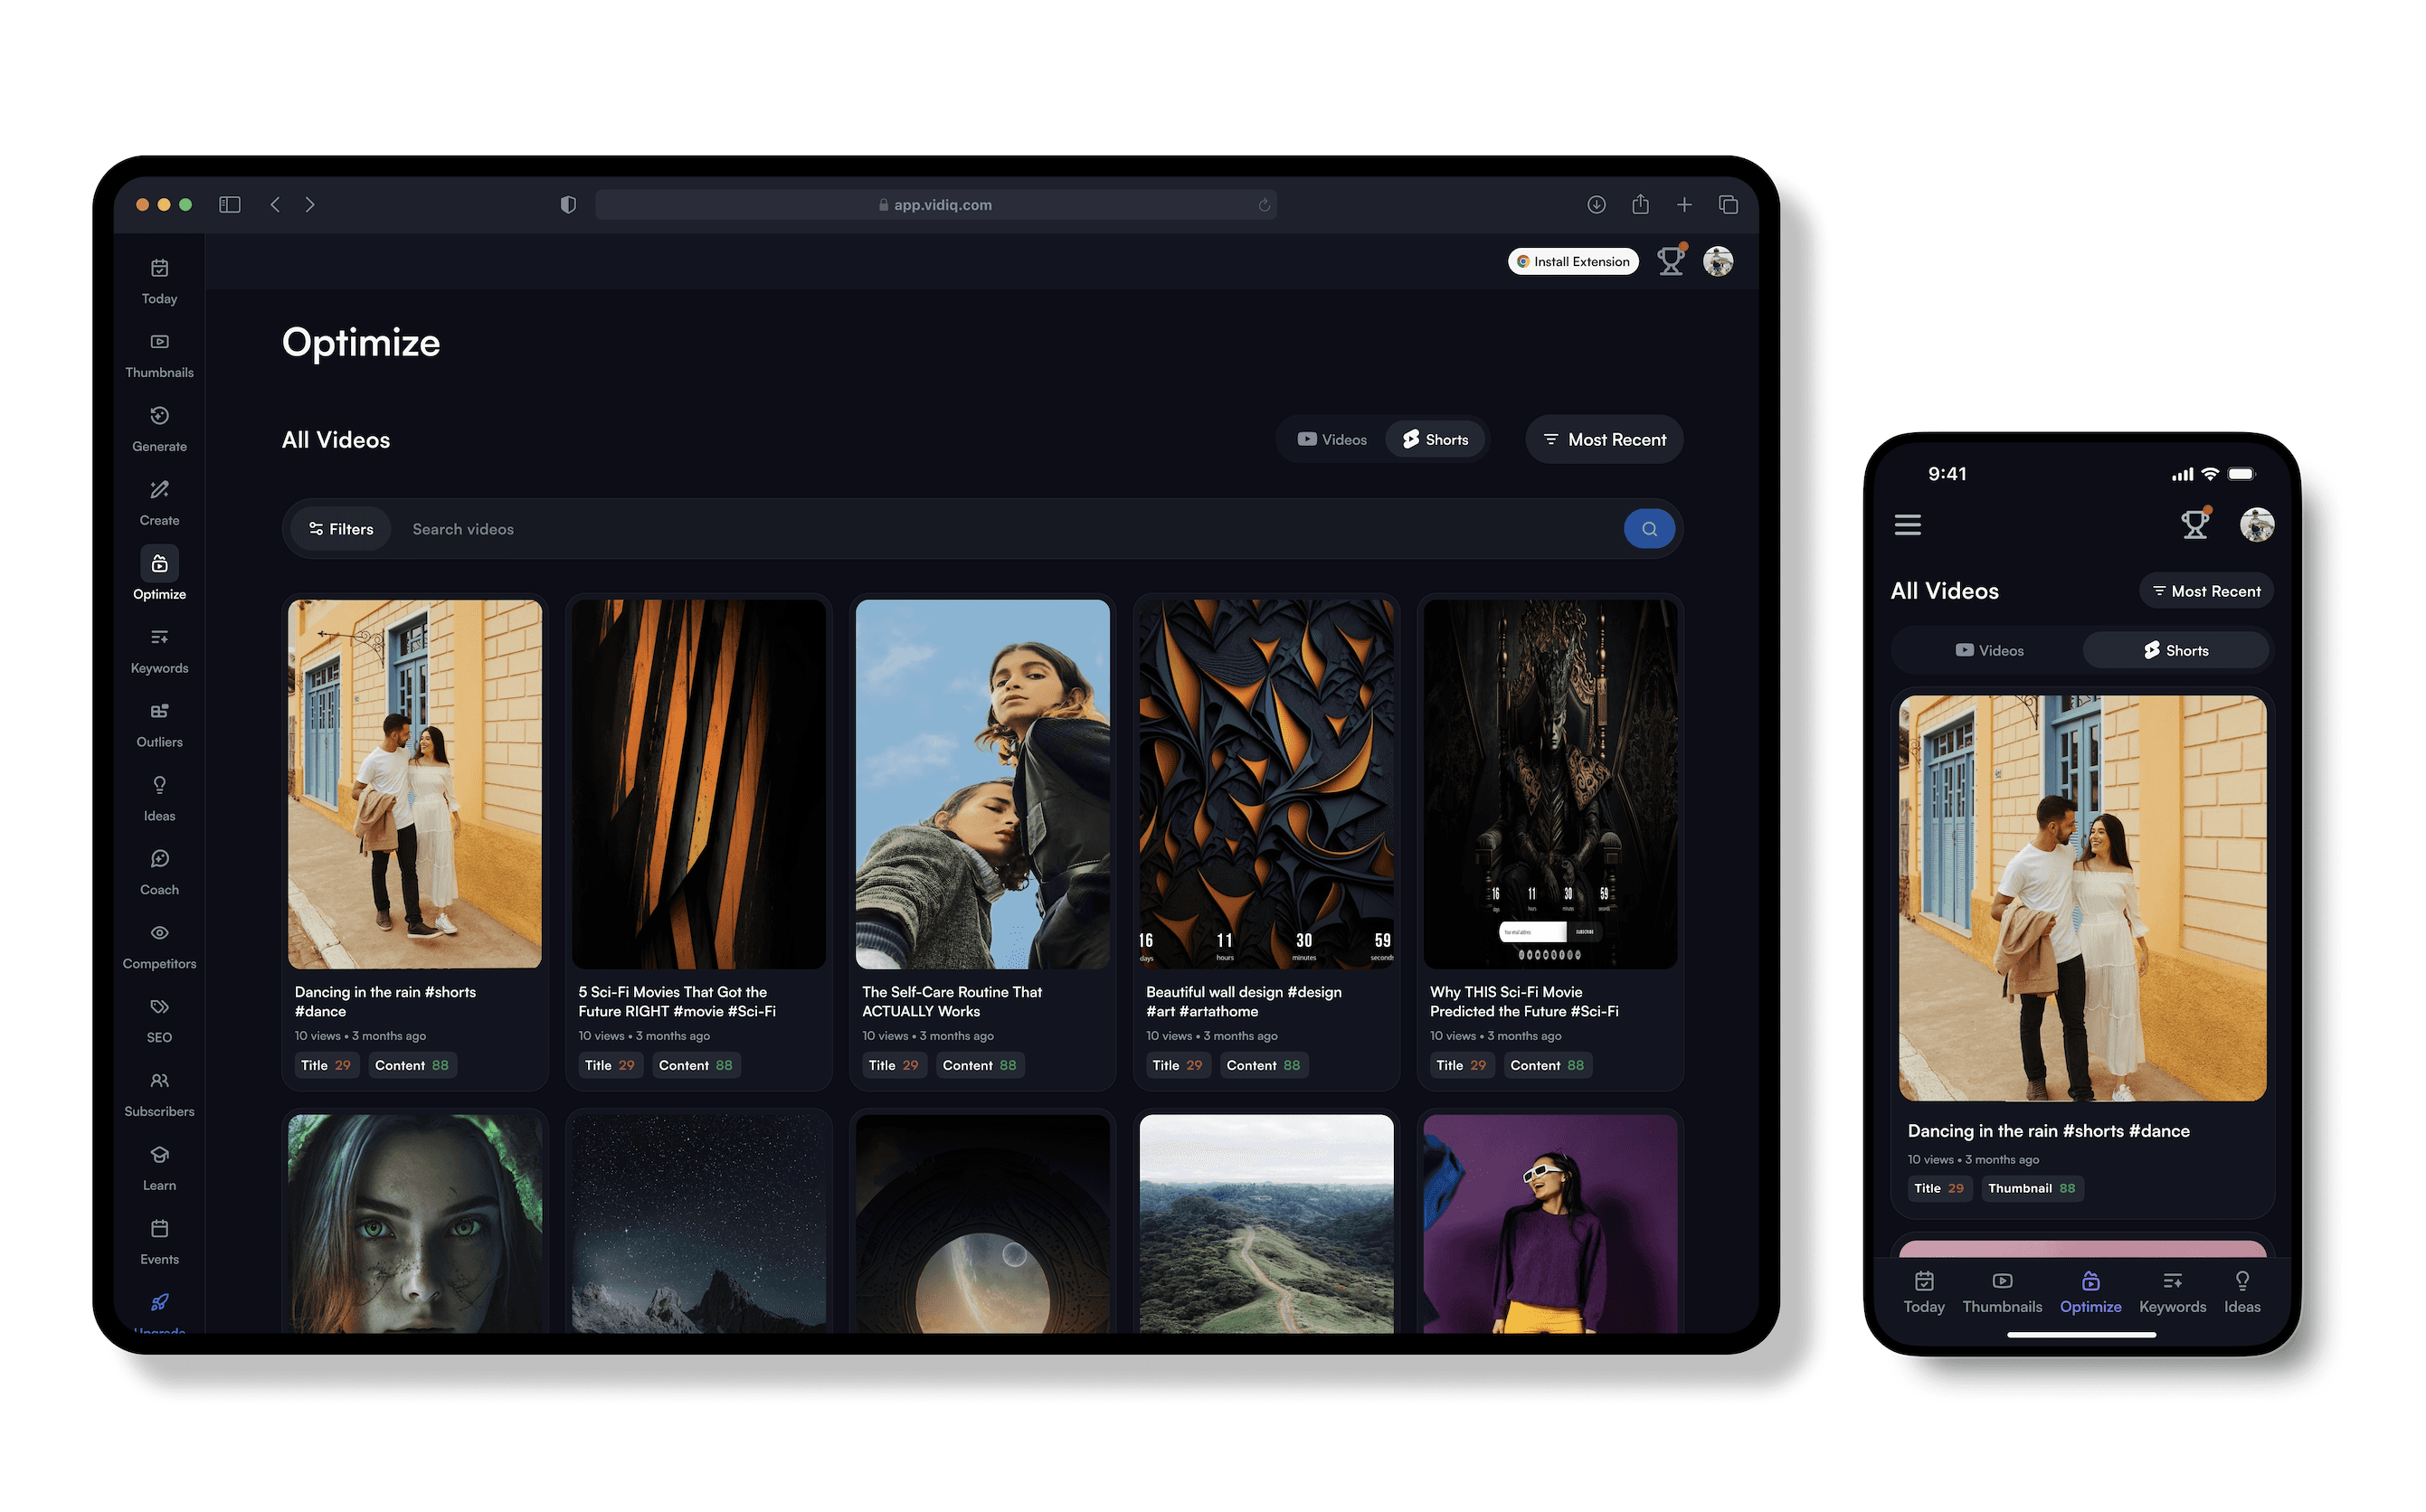
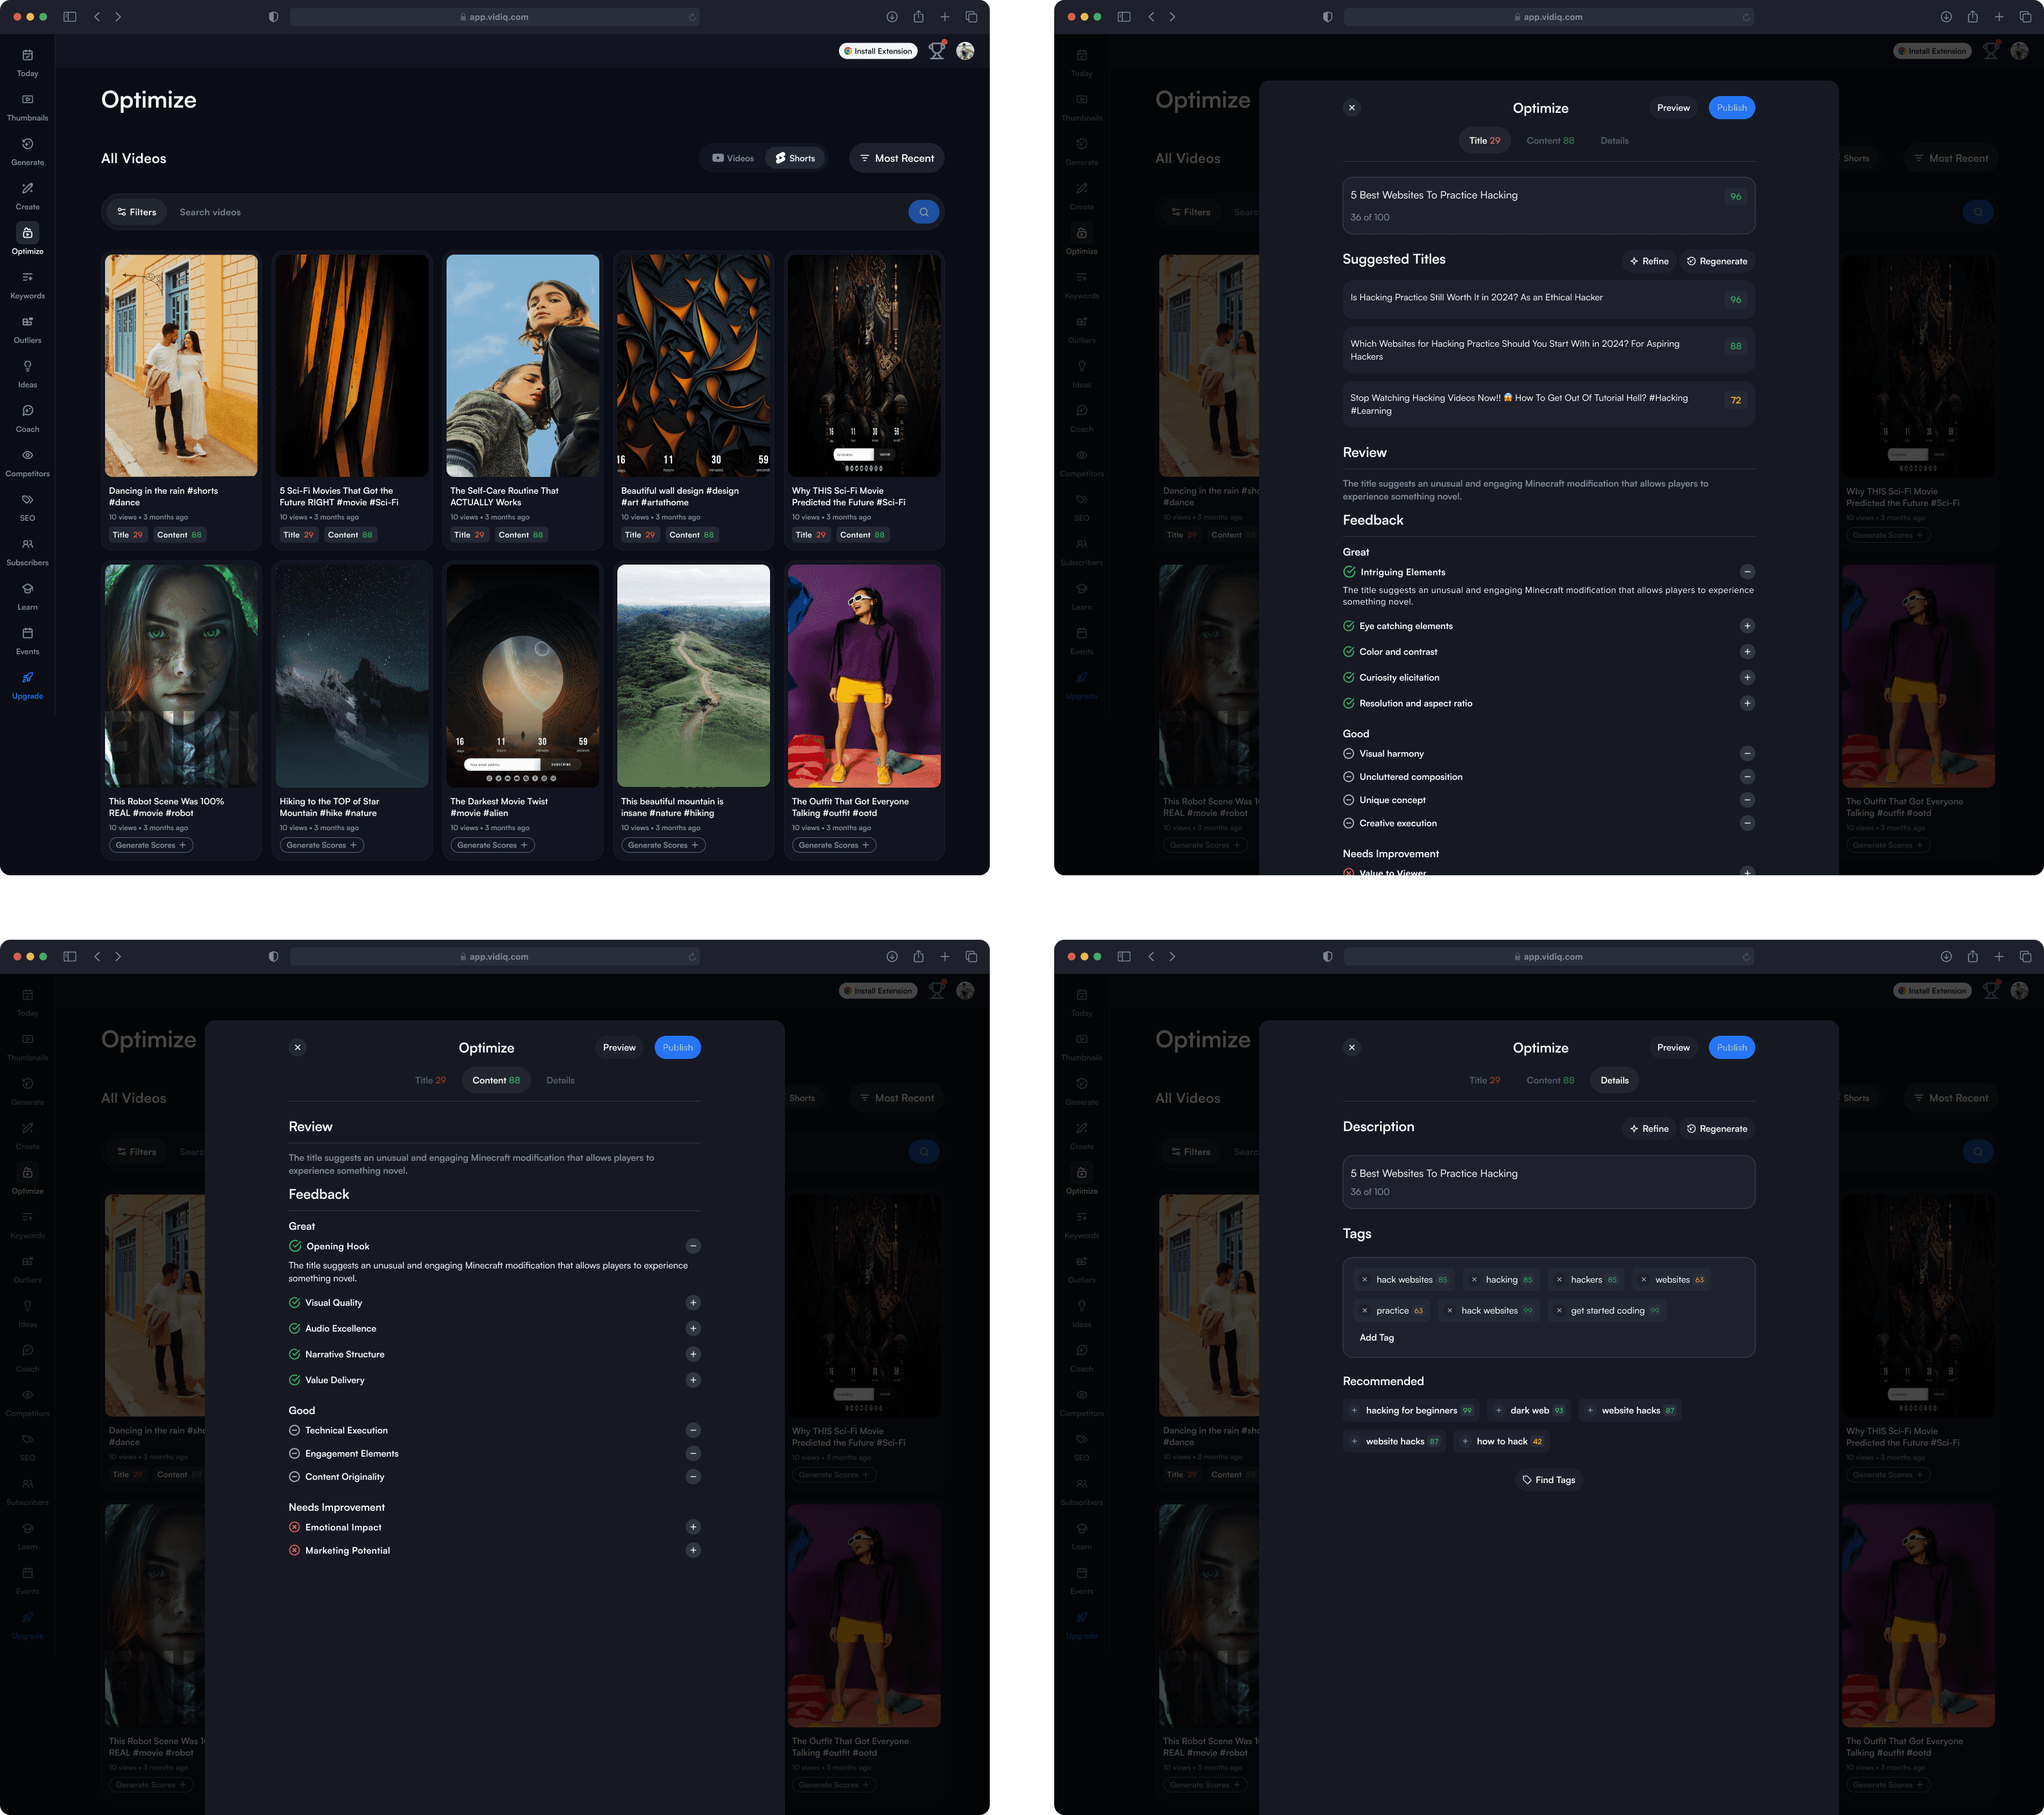
Optimize screen
This is the page users see when they click on the ‘Optimize’ tab in the navigation bar. It allows users to view their existing YouTube Shorts, rated based on title and content. They can scroll down to see more of their Shorts videos.
In the top right corner, users can also sort their videos by ‘Most Recent’, ‘Lowest Title Score’, and ‘Lowest Thumbnail Score’.
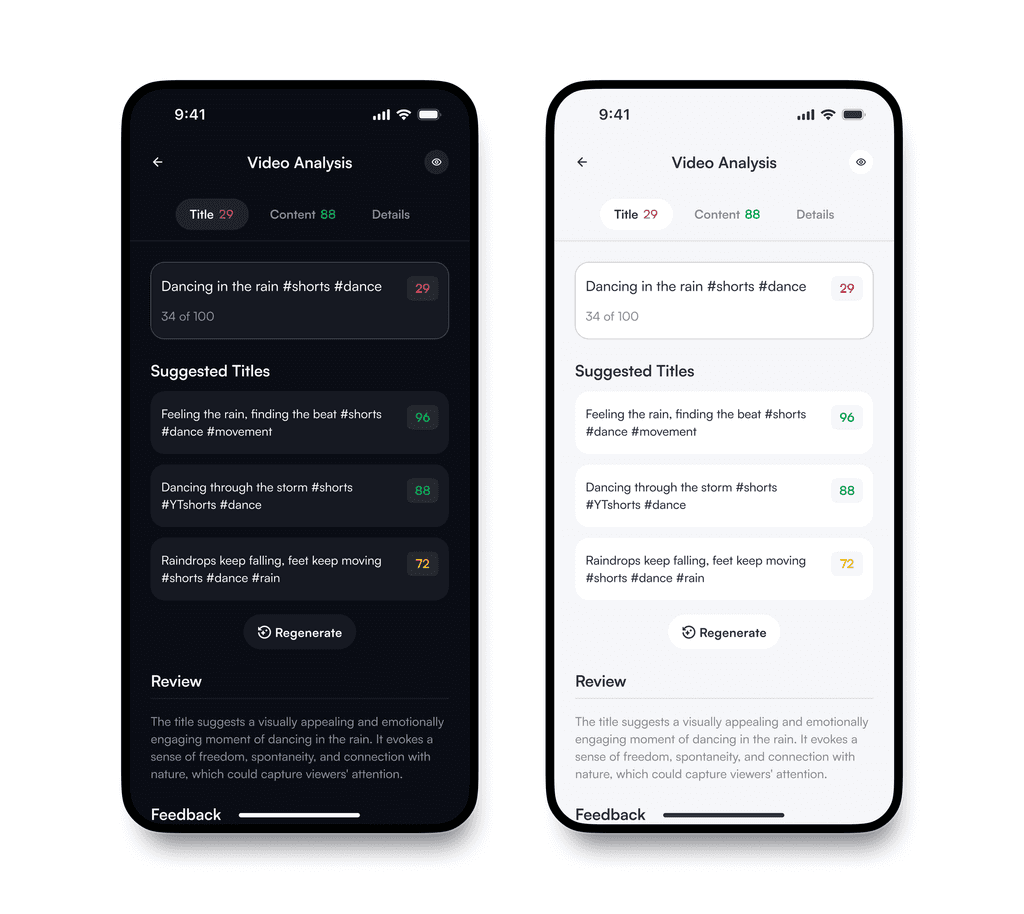
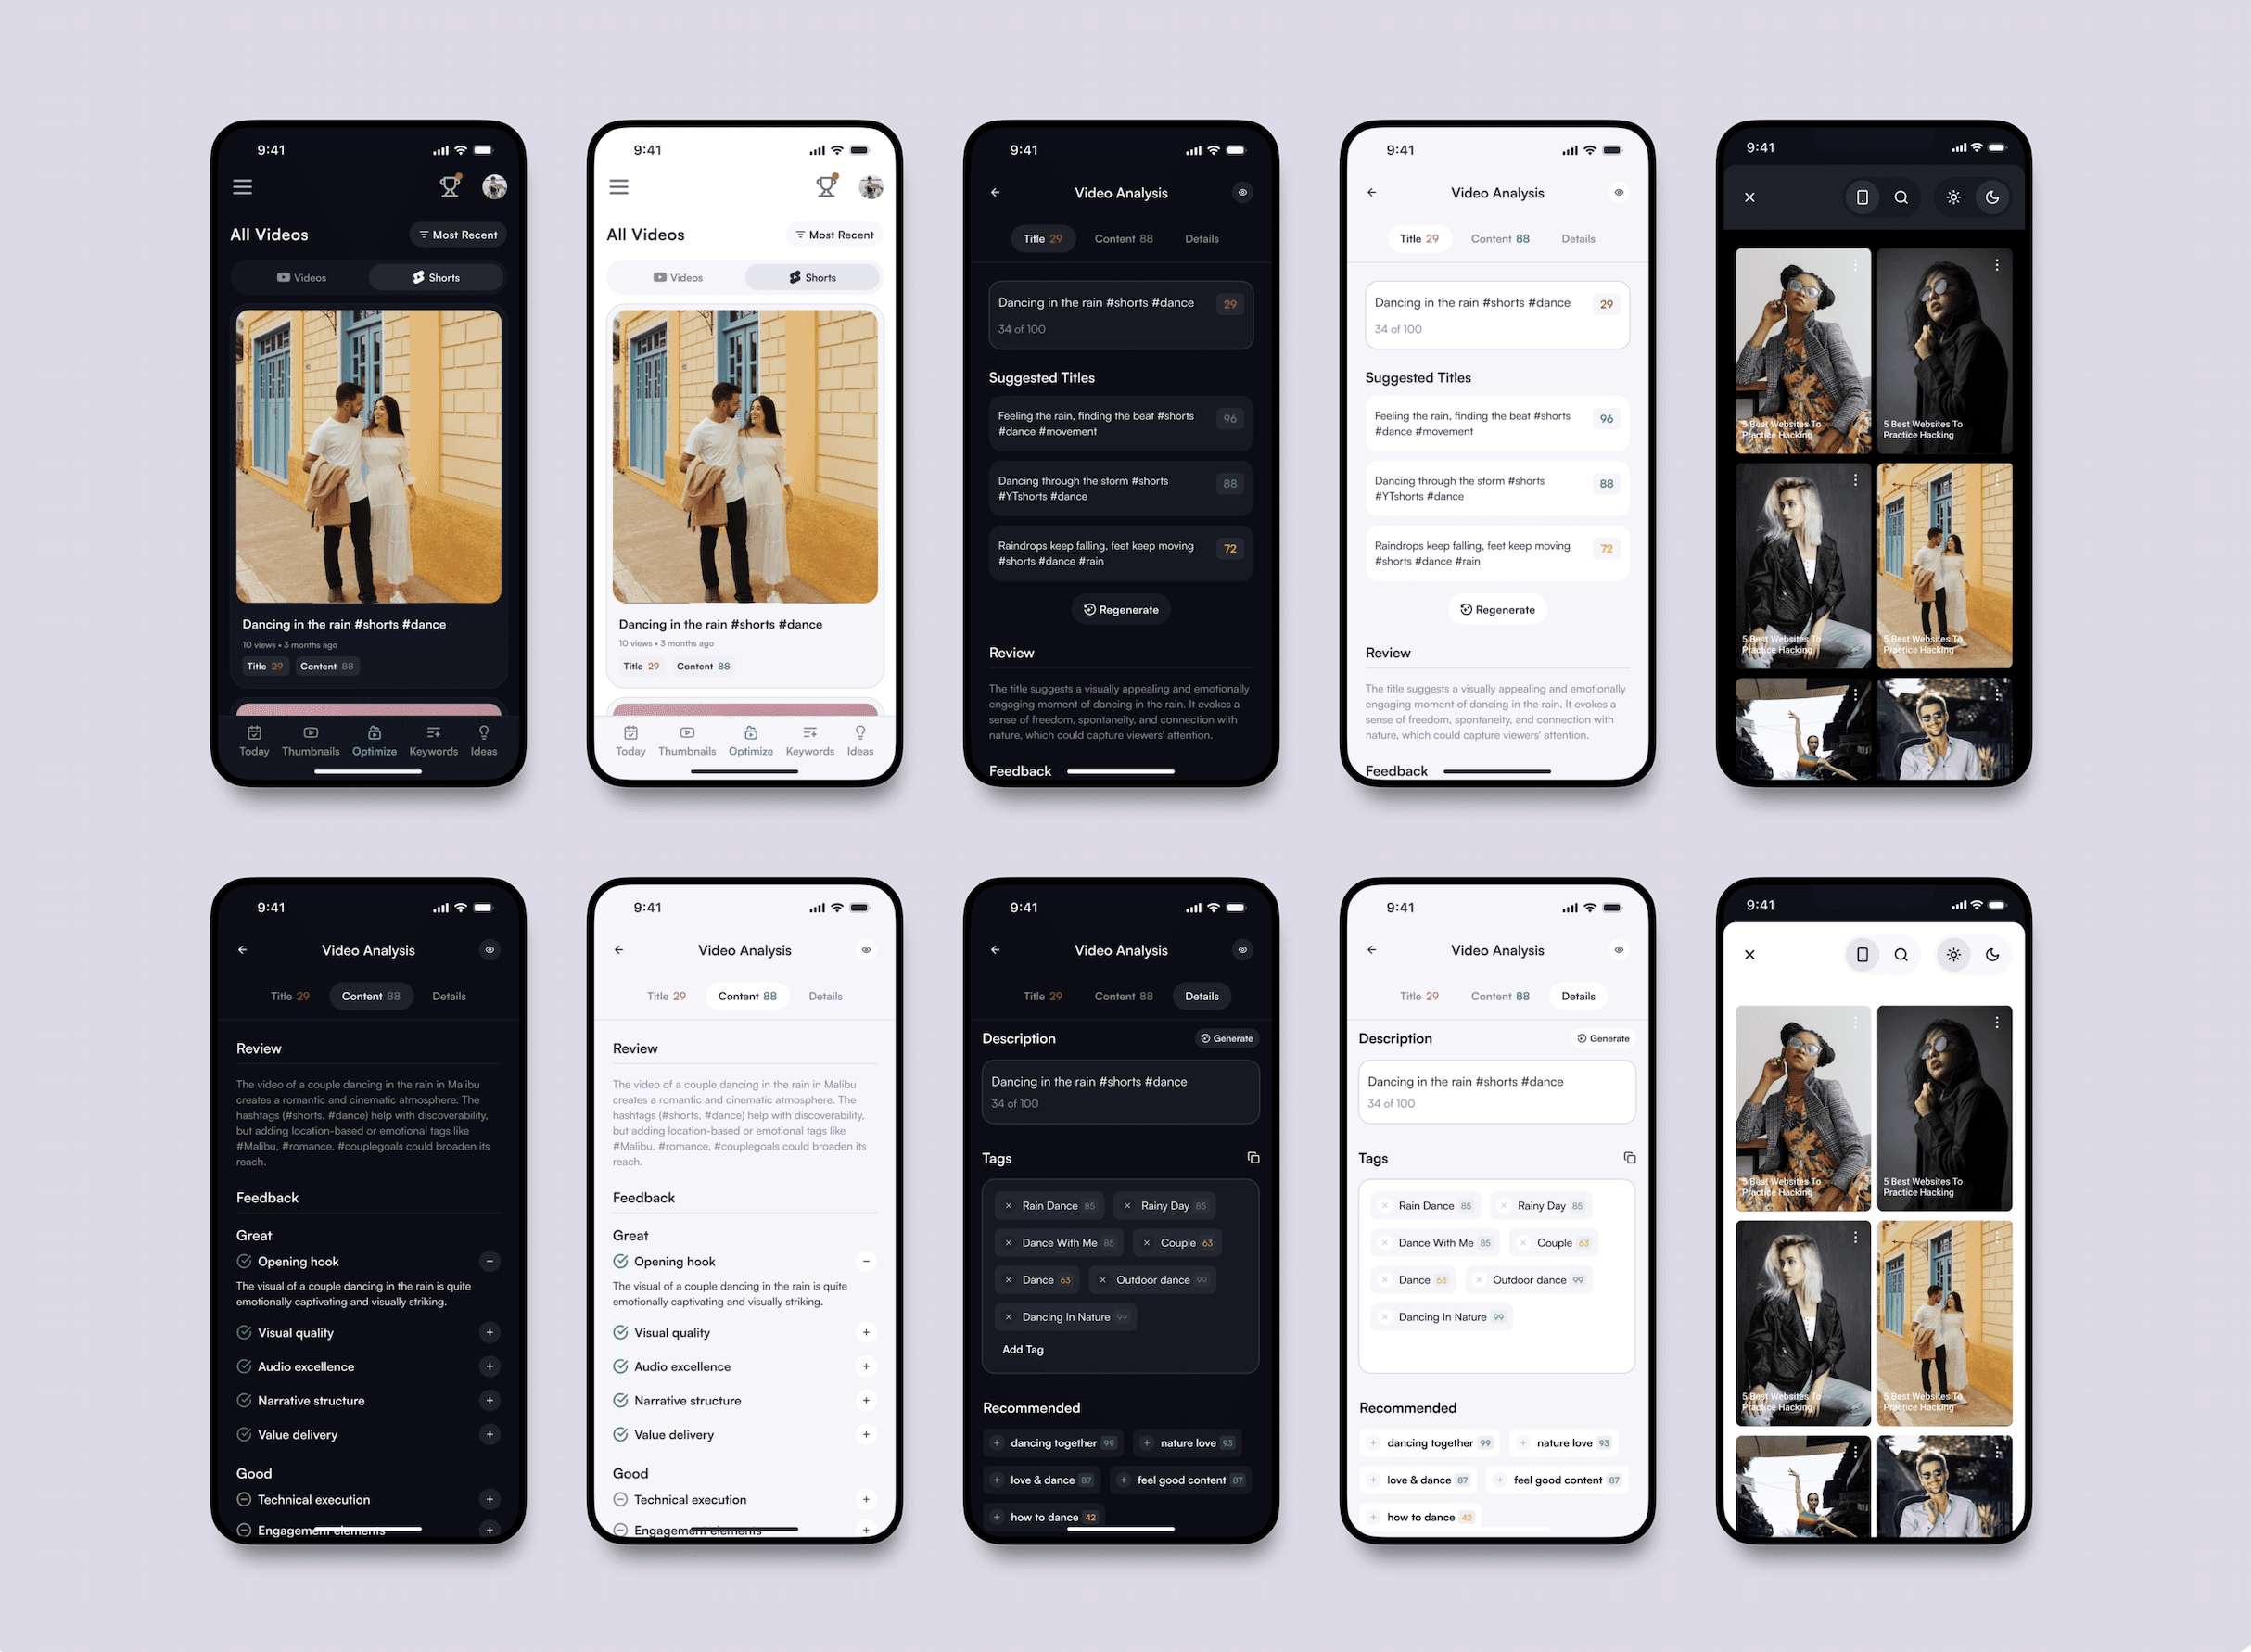
Title score:
When users click on a video, they are taken to the video analysis page. Here, they can view suggested titles, a review of the title and feedback, as well as the criteria on which the title score is based.
Users can edit the title themselves or regenerate title suggestions if they are not satisfied with the current ones.
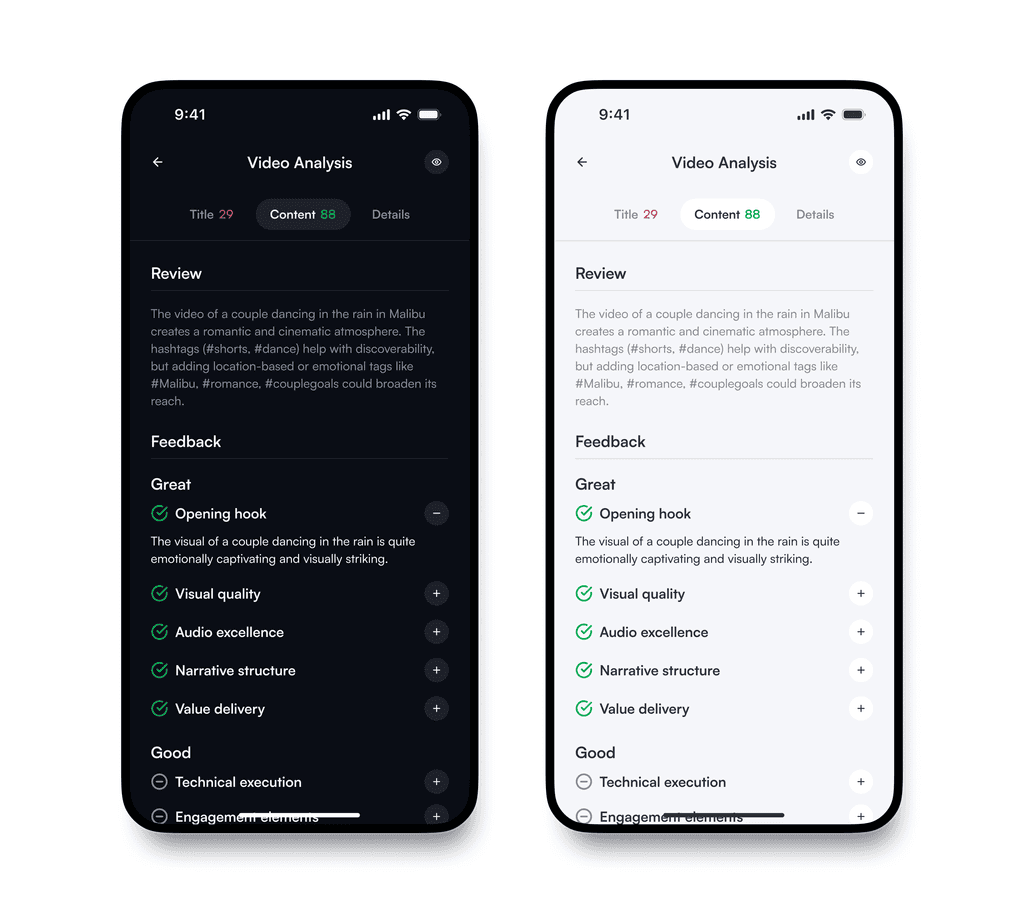
Content score
Under the Content tab, users can view a review of their video content along with the feedback points.
Similar to the title feedback, the content feedback also displays the criteria the content score is based on, along with an explanation of what the points mean. By default, the descriptions are hidden, and users need to click the plus button on the side to expand them.
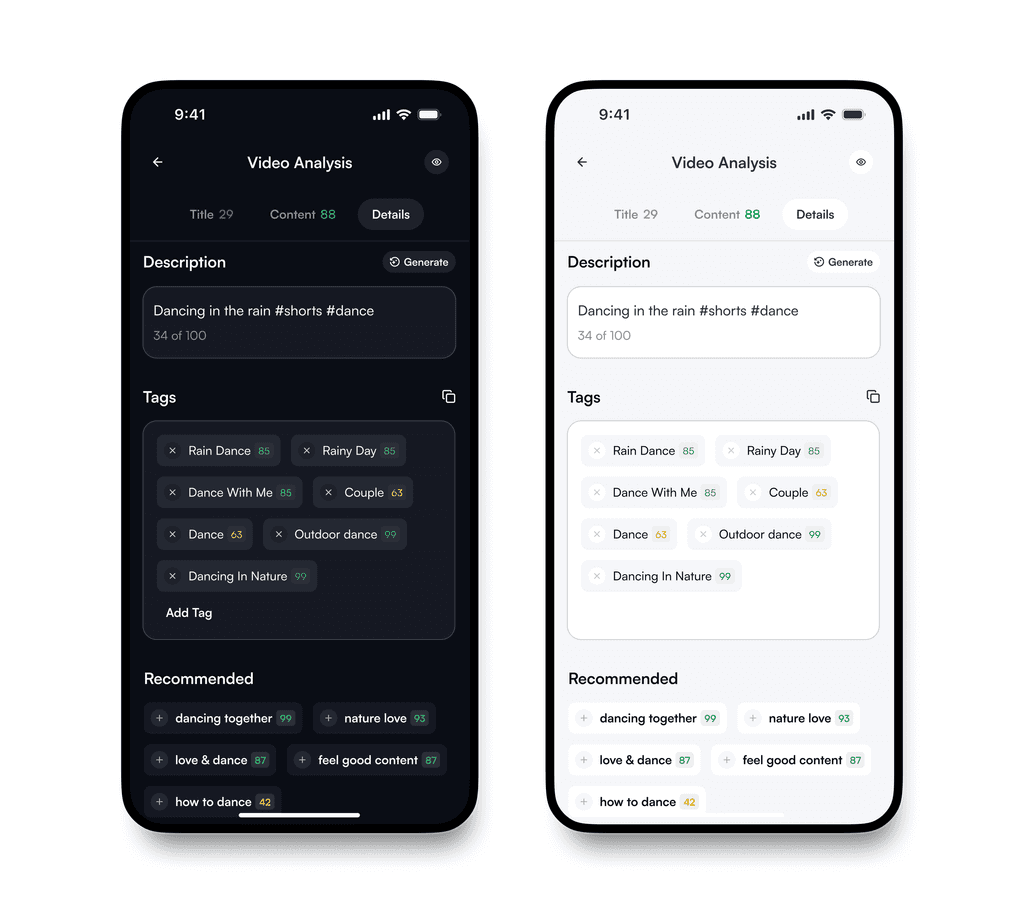
Details screen
Under the Details tab, users can view the recommended description and tags. They can regenerate the description for their video and click on the recommended tags to add them to their own tag list.
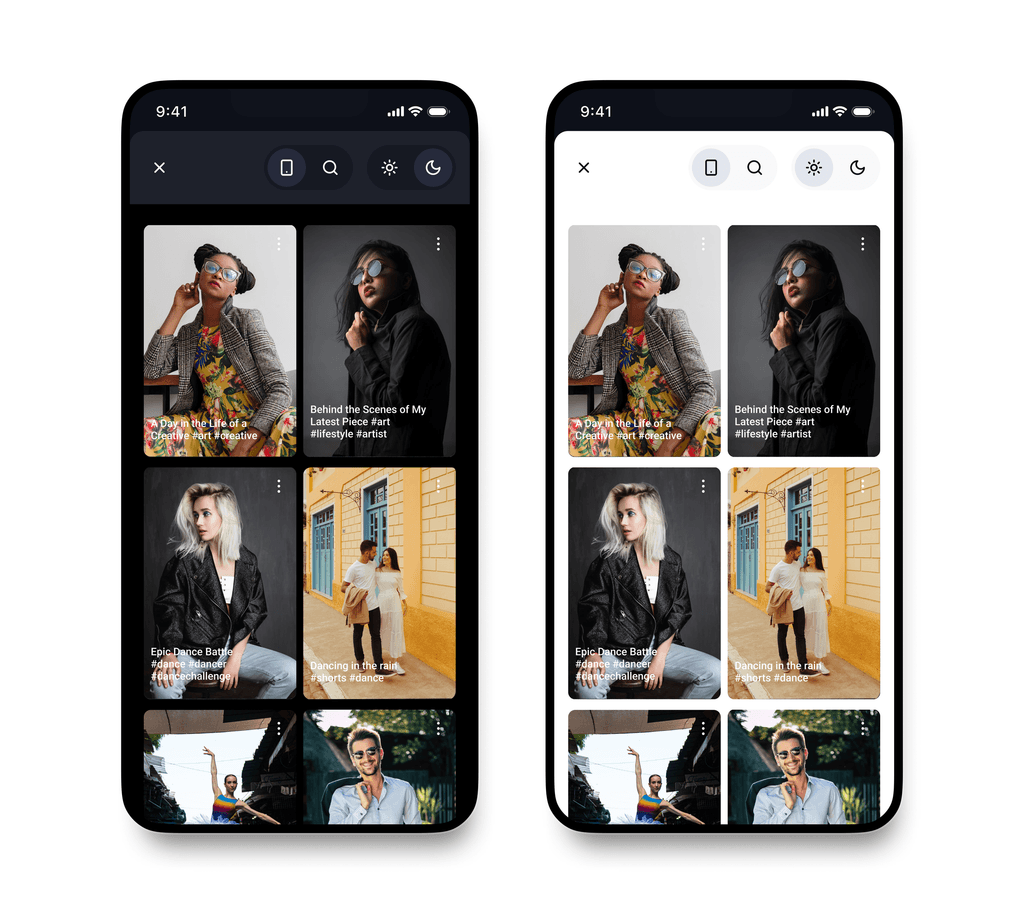
Preview screen
When users click on the eye icon in the top right corner, they are taken to the preview screen. This allows them to see what their video would look like compared to other videos, reflecting the actual YouTube experience. Users can also toggle between dark and light mode.
Business Impact
1
of the biggest requests from CS team
A key business need flagged by the CS team as a common user pain point.
0.71%
purchases increase
Supporting the business goal of improving conversion rates
75k
shorts videos
are opened daily through Optimization Tool, demonstrating strong product usage.
2.3%
retention rate increase
Suggesting users found the experience more engaging and worth returning to.